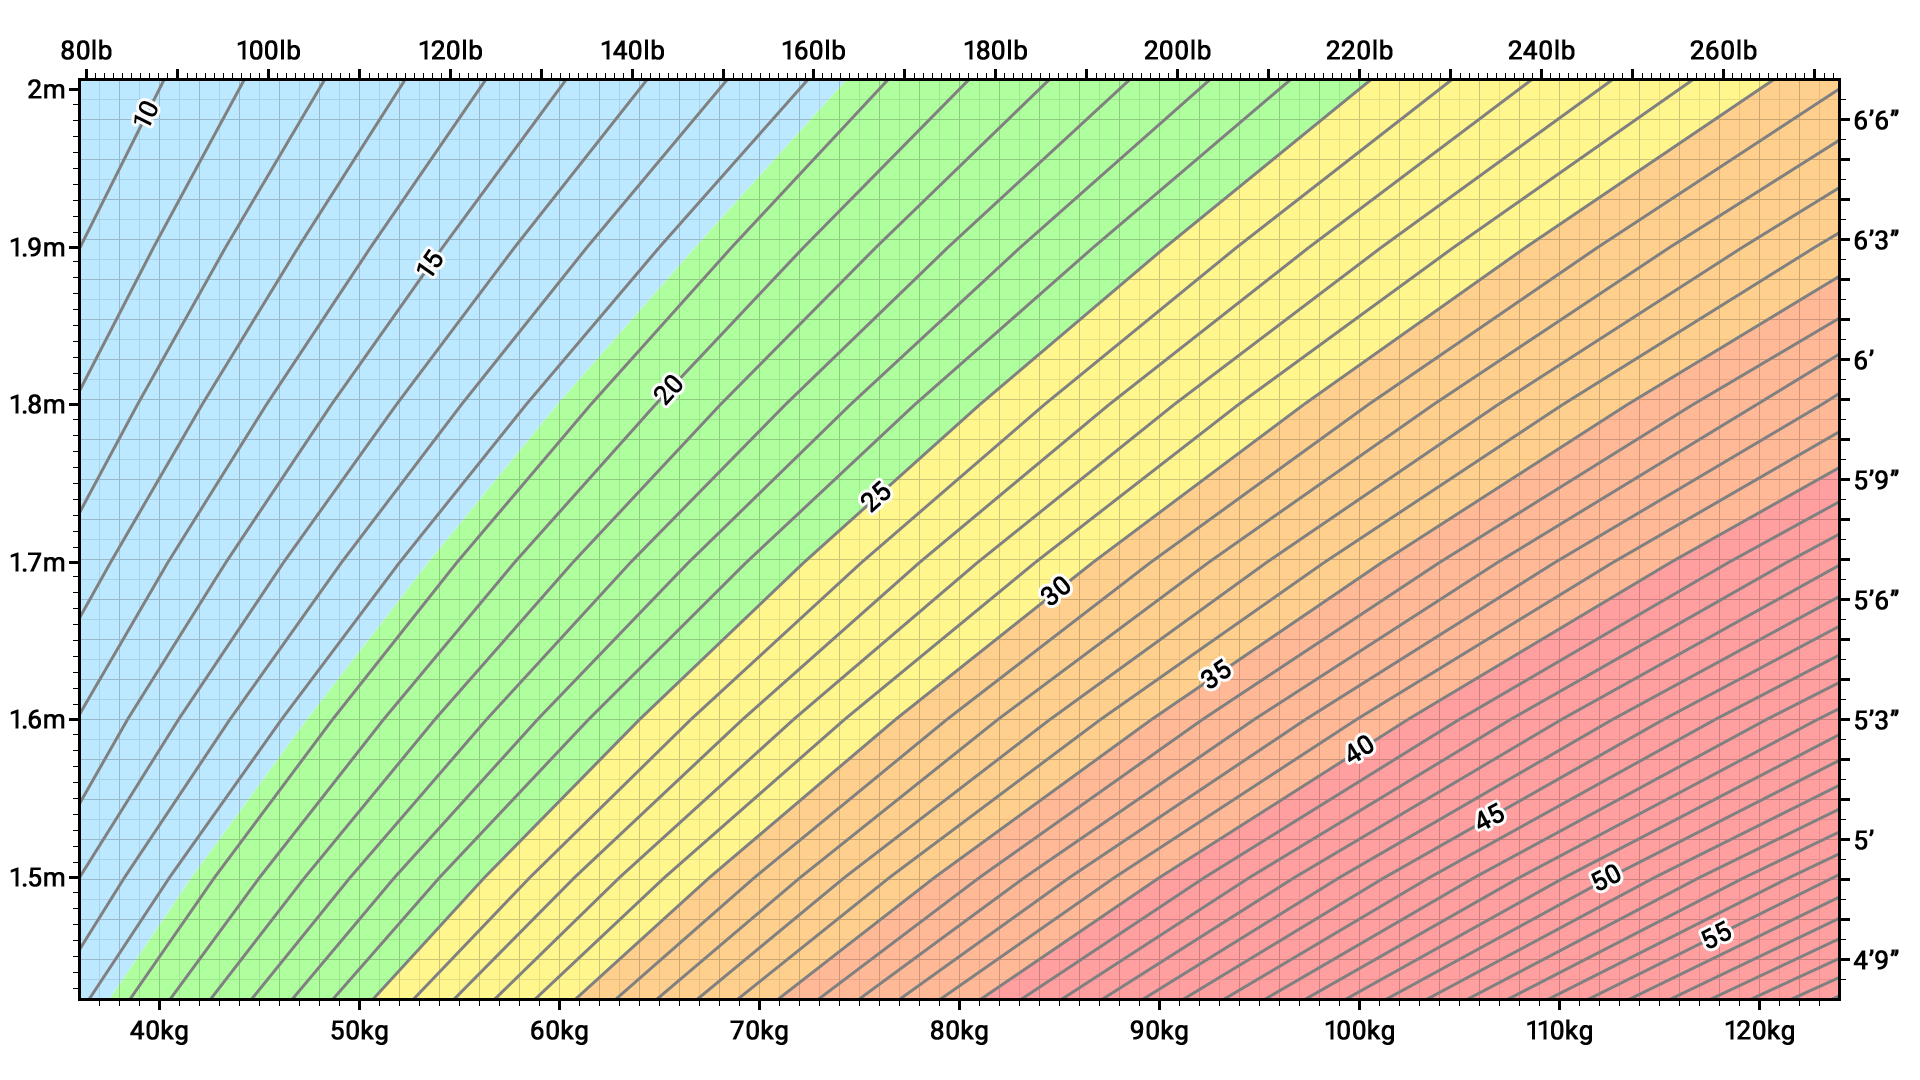
| Blue |
Underweight (Severe thinness) |
Less than 16.0 |
| Blue |
Underweight (Moderate thinness) |
16.0 to 16.9 |
| Blue |
Underweight (Mild thinness) |
17.0 to 18.4 |
| Green |
Normal range |
18.5 to 24.9 |
| Yellow |
Overweight (Pre-obese) |
25.0 to 29.9 |
| Orange |
Obese (Class I) |
30.0 to 34.9 |
| Dark Orange |
Obese (Class II) |
35.0 to 39.9 |
| Red |
Obese (Class III) |
40.0 and Greater |
 ❌
❌